Note
Go to the end to download the full example code.
Representational Similarity Analysis (RSA)
Perform Representational Similarity Analysis (RSA).
RSA is performed on estimated latent representations from a VAE and a contrastive VAE trained on the ABIDE dataset.
Import
import os
import pathlib
import zipfile
from itertools import combinations

import matplotlib.colors as mcolors
import matplotlib.pyplot as plt
import numpy as np
import pandas as pd
import requests
import seaborn as sns
from scipy.spatial.distance import pdist, squareform
from scipy.stats import kendalltau, ttest_1samp
from scipy.stats import ttest_ind as ttest
from sklearn.decomposition import PCA
Utils
Let’s define some functions.
def data2cmat(data):
    """ Compute pairwise (dis)similarity matrices.
    """
    return np.array([squareform(pdist(data[idx], metric="euclidean"))
                     for idx in range(len(data))])


def vec2cmat(vec, data_scale="ratio", metric="euclidean"):
    """ Compute pairwise (dis)similarity matrice for a specific clinical
    characteristic vector.
    """
    vec = (vec - vec.min()) / (vec.max() - vec.min())
    if vec.ndim == 1:
        vec = np.vstack((vec, np.zeros(vec.shape))).transpose()
    cmat = squareform(pdist(vec, metric=metric).transpose())
    if data_scale == "ordinal":
        cmat[cmat != 0] = 1
    return cmat


def mat2triu(arr):
    """ Get similarity matrix upper triangular.
    """
    assert np.ndim(arr) == 2, "Expect 2 dim similarity!"
    assert arr.shape[0] == arr.shape[1], "Expect square similarity!"
    n_dims = arr.shape[0]
    triu_vec = arr[np.triu_indices(n=n_dims, k=1)]
    return triu_vec


def fit_rsa(smat, cmat, idxs=None):
    """ Compare dissimilarity matrix to the matrices for each individual
    characteristic using the Kendall rank correlation coefficient.
    """
    if smat.ndim > 2:
        r = np.array([
            kendalltau(mat2triu(smat[idx][idxs, :][:, idxs]),
                       mat2triu(cmat))[0]
            for idx in range(10)])
        r = np.arctan(r)
        return r
    else:
        tau, pval = kendalltau(mat2triu(smat), mat2triu(cmat))
        return tau, pval


def plot_mat(key, mat, ax=None, figsize=(5, 2), dpi=300, fontsize=16,
             fontweight="bold", title=None, vmin=None, vmax=None):
    """ Display a mat array.

    Parameters
    ----------
    key: str
        the mat array identifier.
    mat: array (n, n)
        the mat array to display.
    ax: matplotlib.axes.Axes, default None
        the axes used to display the plot.
    figsize: (float, float), default (5, 2)
        width, height in inches.
    dpi: float, default 300
        the resolution of the figure in dots-per-inch.
    fontsize: int or str, default 16
        size in points or relative size, e.g., 'smaller', 'x-large'.
    fontweight: str, default 'bold'
        the font weight, e.g. 'normal', 'bold', 'heavy', 'light', 'ultrabold'
        or 'ultralight'.
    title: str, default None
        the title displayed on the figure.
    vmin: float, default None
        minimum value on y-axis of figures.
    vmax: float, default None
        maximum value on y-axis of figures.
    """
    if ax is None:
        _, ax = plt.subplots(1, 1, figsize=figsize, dpi=dpi)
    ax.imshow(mat, aspect="equal", cmap="Reds", vmin=vmin, vmax=vmax)
    ax.set_axis_off()
    if title is None:
        plt.title(key, fontsize=fontsize * 1.5, pad=2, fontweight=fontweight)
    else:
        plt.title(title, fontsize=fontsize * 1.5, pad=2, fontweight=fontweight)


def plot_bar(key, rsa, ax=None, figsize=(5, 2), dpi=300, fontsize=16,
             fontsize_star=25, fontweight="bold", line_width=2.5,
             marker_size=.1, title=None, palette="Spectral", report_t=False,
             do_pairwise_stars=False, do_one_sample_stars=True,
             yname="model fit (r)"):
    """ Display results with bar plots.

    Parameters
    ----------
    key: str
        the analysis identifier.
    rsa: dict of dict
        the sampling data with the analysis identifiers as first key and
        experimental conditions as second key.
    ax: matplotlib.axes.Axes, default None
        the axes used to display the plot.
    figsize: (float, float), default (5, 2)
        width, height in inches.
    dpi: float, default 300
        the resolution of the figure in dots-per-inch.
    fontsize: int or str, default 16
        size in points or relative size, e.g., 'smaller', 'x-large'.
    fontsize_star: int or str, default 25
        size in points or relative size, e.g., 'smaller', 'x-large' used to
        display pairwise statistics.
    fontweight: str, default 'bold'
        the font weight, e.g. 'normal', 'bold', 'heavy', 'light', 'ultrabold'
        or 'ultralight'.
    line_width: int, default 2.5
        the bar plot line width.
    marker_size: int, default .1
        the sampling scatter plot marker size.
    title: str, default None
        the title displayed on the figure.
    palette: palette name, list, or dict
        colors to use for the different levels of the hue variable.
        Should be something that can be interpreted by color_palette(), or a
        dictionary mapping hue levels to matplotlib colors.
    report_t: bool, default False
        optionally, generate a report with pairwise statistics.
    do_pairwise_stars: bool, default False
        optionally, display pairwise statistics.
    do_one_sample_stars: bool, default True
        optionally, display sampling statistics.
    yname: str, default 'model fit (r)'
        optionally, name of the metric on y-axis.

    Returns
    -------
    pairwise_stat_df: pandas.DataFrame or None
        the generated pairwise statistics.
    """
    if ax is None:
        _, ax = plt.subplots(1, 1, figsize=figsize, dpi=dpi)

    data = rsa[key]
    data_ = {}
    for cond in list(data.keys()):
        data_.setdefault("model fit (r)", []).extend(data[cond])
        data_.setdefault("condition", []).extend([cond] * len(data[cond]))
    data_df = pd.DataFrame.from_dict(data_)

    sns.stripplot(data=data_df,
                  x="condition",
                  y="model fit (r)",
                  jitter=0.15,
                  alpha=1.0,
                  color="k",
                  size=marker_size)
    plot = sns.barplot(data=data_df,
                       x="condition",
                       y="model fit (r)",
                       err_kws={"color": "r", "linewidth": 2.5},
                       alpha=0.3,
                       linewidth=line_width,
                       palette=palette)
    for patch in plot.containers[0]:
        fc = patch.get_edgecolor()
        patch.set_edgecolor(mcolors.to_rgba(fc, 1.))
    locs, _ = plt.yticks()
    new_y = locs
    new_y = np.linspace(locs[0], locs[-1], 6)
    plt.yticks(new_y, labels=[f"{yy:.2f}" for yy in new_y], fontsize=fontsize,
               fontweight=fontweight)
    plt.ylabel(yname, fontsize=fontsize, fontweight=fontweight)
    ax.spines["top"].set_visible(False)
    ax.spines["right"].set_visible(False)
    ax.spines["bottom"].set_visible(False)
    for axis in ["top", "bottom", "left", "right"]:
        ax.spines[axis].set_linewidth(line_width)
    xlabels = [item.get_text() for item in ax.get_xticklabels()]
    xlabels_ = ["\n".join(item.split("_")) for item in xlabels]
    ax.set_xticks(ax.get_xticks())
    ax.set_xticklabels(xlabels_, fontsize=fontsize, fontweight=fontweight)
    x_label = ax.axes.get_xaxis().get_label()
    x_label.set_visible(False)
    ylim = plt.ylim()
    plt.ylim(np.array(ylim) * (1, 1.1))
    if title is None:
        plt.title(key, fontsize=fontsize * 1.5, pad=2, fontweight=fontweight)
    else:
        plt.title(title, fontsize=fontsize * 1.5, pad=2, fontweight=fontweight)

    if do_one_sample_stars:
        one_sample_thresh = np.array((1, .05, .001, .0001))
        one_sample_stars = np.array(("n.s.", "*", "**", "***"))
        for idx, name in enumerate(xlabels):
            one_sample = ttest_1samp(data[name], 0)
            these_stars = one_sample_stars[
                max(np.nonzero(one_sample.pvalue < one_sample_thresh)[0])]
            xlabels_[idx] = f"{xlabels_[idx]}\n({these_stars})"
        ax.set_xticks(ax.get_xticks())
        ax.set_xticklabels(xlabels_, fontsize=fontsize, fontweight=fontweight)

    if report_t or do_pairwise_stars:
        size = len(xlabels)
        pairwise_t = np.zeros((size, size))
        pairwise_p = np.zeros((size, size))
        data_ = {}
        for idx1, name1 in enumerate(xlabels):
            for idx2, name2 in enumerate(xlabels):
                n_samples = len(data[name1])
                tval, pval = ttest(data[name1], data[name2])
                if pval > .001:
                    print(f"{key} {name1} >  {name2} | "
                          f"t({n_samples - 1}) = {tval:.2f} p = {pval:.2f}")
                else:
                    print(f"{key} {name1} >  {name2} | "
                          f"t({n_samples - 1}) = {tval:.2f} p < .001")
                pairwise_t[idx1, idx2] = tval
                pairwise_p[idx1, idx2] = pval
                data_.setdefault("pair", []).append(
                    f"qname-{key}_src-{name1.replace('_', '-')}_"
                    f"dest-{name2.replace('_', '-')}")
                data_.setdefault("tval", []).append(tval)
                data_.setdefault("pval", []).append(pval)
        pairwise_stat_df = pd.DataFrame.from_dict(data_)
    else:
        pairwise_stat_df = None

    if do_pairwise_stars:
        from statannotations.Annotator import Annotator
        pairwise_sample_thresh = np.array((1, .05, .001, .0001))
        pairwise_sample_stars = np.array(("n.s.", "*", "**", "***"))
        comps = list(combinations(range(len(xlabels)), 2))
        pairs, annotations = [], []
        for this_comp in comps:
            sig_idx = max(np.nonzero(
                pairwise_p[this_comp[0], this_comp[1]] <
                pairwise_sample_thresh)[0])
            if sig_idx != 0:
                stars = pairwise_sample_stars[sig_idx]
                pairs.append([xlabels[this_comp[0]], xlabels[this_comp[1]]])
                annotations.append(stars)
        if len(pairs) > 0:
            annotator = Annotator(
                ax, pairs, data=data_df, x="condition", y="model fit (r)",
                order=xlabels)
            annotator.set_custom_annotations(annotations)
            annotator.annotate()

    return pairwise_stat_df
Data
Let’s define where are stored the data.
url = (
    "https://zenodo.org/records/6304004/files/sccnlab/"
    "pub-CVAE-MRI-ASD-v1.0.0.zip?download=1"
)
zip_file = "/tmp/data.zip"
data_dir = "/tmp/rsa"
if not os.path.isdir(data_dir):
    print("Downloading...")
    response = requests.get(url)
    response.raise_for_status()
    pathlib.Path(zip_file).write_bytes(response.content)
    print(f"Saved: {zip_file}")
    with zipfile.ZipFile(zip_file, "r") as of:
        of.extractall(data_dir)
    print(f"Unzipped into: {data_dir}")

datadir = "/tmp/rsa/sccnlab-pub-CVAE-MRI-ASD-1a2cf47/Data"
latent_data = np.load(os.path.join(datadir, "latent_vecs10.npz"))
meta_df = pd.read_csv(os.path.join(datadir, "ABIDE_legend_S982.csv"))
patients_indices = (meta_df["DxGroup"].values == 1)
Downloading...
Saved: /tmp/data.zip
Unzipped into: /tmp/rsa
Similarities
Let’s compute latent vectors similarities.
features_cvae_salient = latent_data["salient_vec_abide"]
features_cvae_background = latent_data["background_vec_abide"]
features_vae = latent_data["vae_vec_abide"]
cmat_cvae_salient = data2cmat(features_cvae_salient)
cmat_cvae_background = data2cmat(features_cvae_background)
cmat_vae = data2cmat(features_vae)
print(f"CVAE salient features similarities: {cmat_cvae_salient.shape}")
print(f"CVAE background features similarities: {cmat_cvae_background.shape}")
print(f"VAE features similarities: {cmat_vae.shape}")
CVAE salient features similarities: (10, 982, 982)
CVAE background features similarities: (10, 982, 982)
VAE features similarities: (10, 982, 982)
Let’s compute clinical score similarities.
clinical_scores = [
    "ADOS_Total", "ADOS_Social", "DSMIVTR", "AgeAtScan", "Sex", "ScannerID",
    "ScanSiteID", "FIQ"]
scale_scores = [
    "ratio", "ratio", "ordinal", "ratio", "ordinal", "ordinal", "ordinal",
    "ratio"]
model_cmats = {}
model_idxs = {}
for qname, scale in zip(clinical_scores, scale_scores, strict=True):
    vec = meta_df[qname].values[patients_indices]
    idx = ~np.isnan(vec)
    vec = vec[idx]
    cmat = vec2cmat(vec, data_scale=scale)
    model_cmats.update({qname: cmat})
    model_idxs.update({qname: idx})
    print(f"{qname} number of outliers measures: {np.sum(~idx)}")
    print(f"{qname} features similarities: {cmat.shape}")

keys_pca = {
    "ADOS_PCA": [
        "ADOS_Total", "ADOS_Comm", "ADOS_Social", "ADOS_StBeh"],
    "ADI_PCA": [
        "ADI_R_SocialTotal", "ADI_R_VerbalTotal", "ADI_R_RRB",
        "ADI_R_Onset Total"],
    "Vineland_PCA": [
        "VINELAND_Receptive_Vscore", "VINELAND_Expressive_Vscore",
        "VINELAND_Written_Vscore", "VINELAND_CommunicationStandard",
        "VINELAND_Personal_Vscore", "VINELAND_Domestic_Vscore",
        "VINELAND_Community_Vscore", "VINELAND_DaylyLiving_Standard",
        "VINELAND_Interpersonal_Vscore", "VINELAND_Play_Vscore",
        "VINELAND_Coping_Vscore", "VINELAND_Socical_Standard",
        "VINELAND_Domestic_Standard", "VINELAND_ABC_Standard",
        "VINELAND_Informant"],
    "WISC_PCA": [
        "WISC4 VCI Verbal Comprehension Index",
        "WISC4 PRI Perceptual Reasoning Index",
        "WISC4 WMI Working Memory Index",
        "WISC4 PSI Processing Speed Index",
        "WISC4 Sim Scaled", "WISC4 Vocab Scaled", "WISC4 Info Scaled",
        "WISC4 Blk Dsn Scaled", "WISC4 Pic Con Scaled",
        "WISC4 Matrix Scaled", "WISC4 Dig Span Scaled",
        "WISC4 Let Num Scaled", "WISC4 Coding Scaled",
        "WISC4 Sym Scaled"]}
for key in keys_pca:
    arr = np.array(meta_df[keys_pca[key]])
    arr = arr[patients_indices]
    idx = ~np.isnan(arr.mean(axis=1))
    mat = arr[idx]
    pca = PCA(n_components=1)
    pca_vec = pca.fit_transform(mat)
    cmat = vec2cmat(pca_vec)
    model_cmats.update({key: cmat})
    model_idxs.update({key: idx})
    print(f"{qname} number of outliers measures: {np.sum(~idx)}")
    print(f"{qname} features similarities: {cmat.shape}")
ADOS_Total number of outliers measures: 101
ADOS_Total features similarities: (369, 369)
ADOS_Social number of outliers measures: 125
ADOS_Social features similarities: (345, 345)
DSMIVTR number of outliers measures: 14
DSMIVTR features similarities: (456, 456)
AgeAtScan number of outliers measures: 0
AgeAtScan features similarities: (470, 470)
Sex number of outliers measures: 0
Sex features similarities: (470, 470)
ScannerID number of outliers measures: 0
ScannerID features similarities: (470, 470)
ScanSiteID number of outliers measures: 0
ScanSiteID features similarities: (470, 470)
FIQ number of outliers measures: 42
FIQ features similarities: (428, 428)
FIQ number of outliers measures: 186
FIQ features similarities: (284, 284)
FIQ number of outliers measures: 188
FIQ features similarities: (282, 282)
FIQ number of outliers measures: 401
FIQ features similarities: (69, 69)
FIQ number of outliers measures: 448
FIQ features similarities: (22, 22)
RSA
Let’s fit RSA.
data = {
"VAE": cmat_vae[:, patients_indices][..., patients_indices],
"CVAE_SL": (
cmat_cvae_background[:, patients_indices][..., patients_indices]
),
"CVAE_BG": cmat_cvae_salient[:, patients_indices][..., patients_indices]
}
rsa_results, rsa_records = {}, {}
for qname in clinical_scores + list(keys_pca.keys()):
for key, smat in data.items():
res = fit_rsa(smat, model_cmats[qname], idxs=model_idxs[qname])
n_samples = len(res)
rsa_records.setdefault(key, []).extend(res.tolist())
rsa_results.setdefault(qname, {})[key] = res
rsa_records.setdefault("score", []).extend([qname] * n_samples)
rsa_df = pd.DataFrame.from_dict(rsa_records)
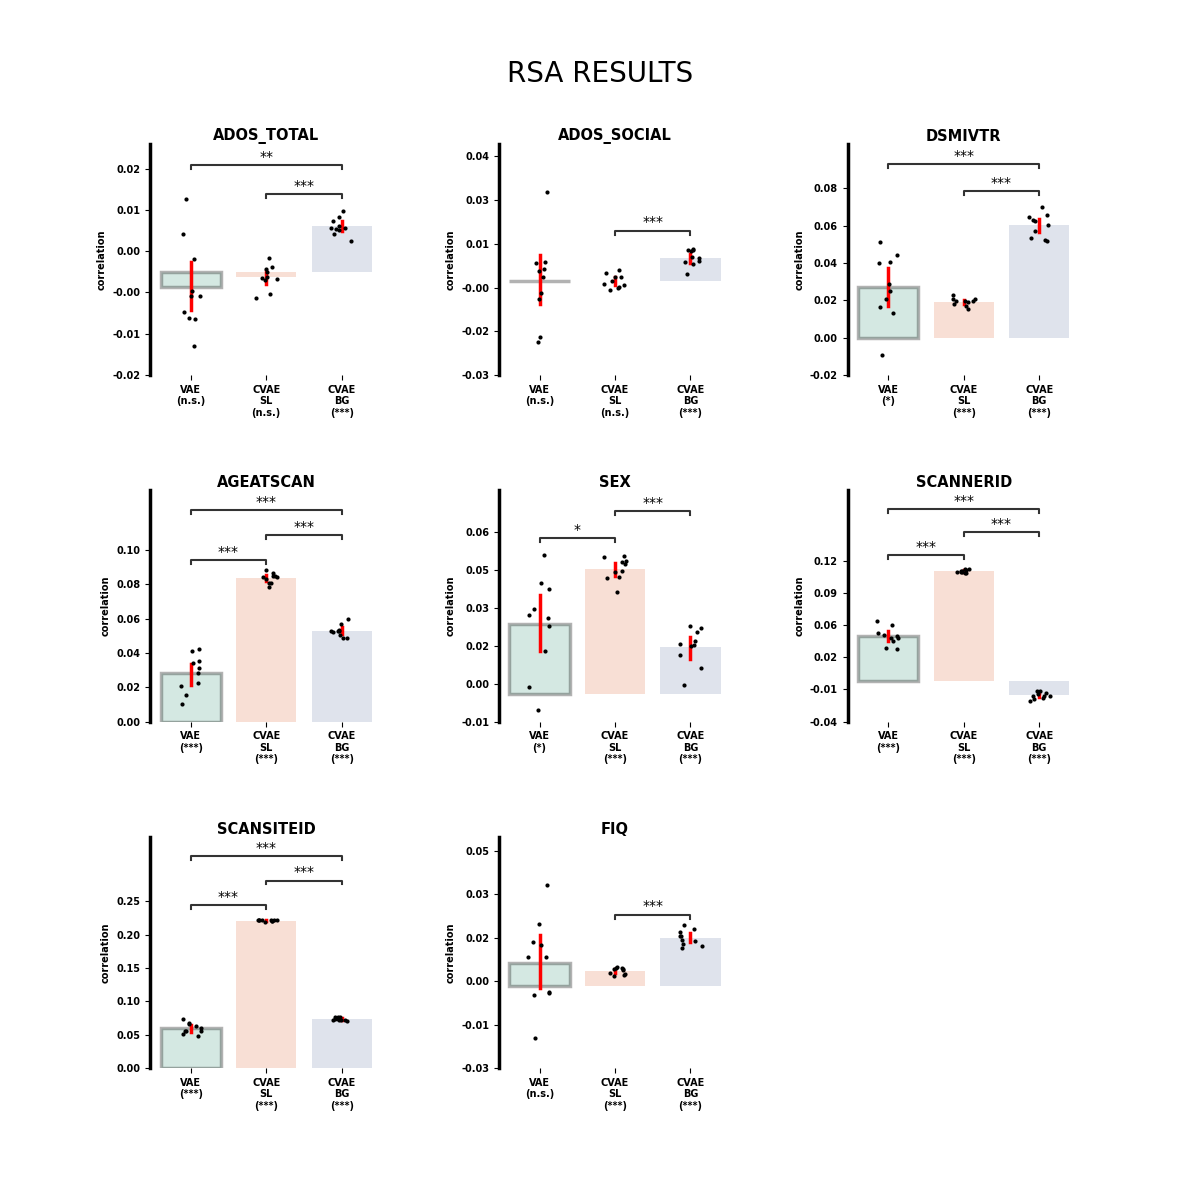
print(rsa_df.groupby("score").describe().loc[
:, (slice(None), ["count", "mean", "std"])])
               VAE                      ... CVAE_BG
             count      mean       std  ...   count      mean       std
score                                   ...
ADI_PCA       10.0 -0.001584  0.013910  ...    10.0 -0.010541  0.002227
ADOS_PCA      10.0 -0.005150  0.012265  ...    10.0  0.009301  0.002820
ADOS_Social   10.0  0.000259  0.013571  ...    10.0  0.007596  0.002528
ADOS_Total    10.0 -0.002921  0.008585  ...    10.0  0.008774  0.001647
AgeAtScan     10.0  0.028175  0.010767  ...    10.0  0.052890  0.003441
DSMIVTR       10.0  0.027082  0.017972  ...    10.0  0.060167  0.006171
FIQ           10.0  0.008734  0.015904  ...    10.0  0.017971  0.002810
ScanSiteID    10.0  0.059434  0.007955  ...    10.0  0.073665  0.002356
ScannerID     10.0  0.044747  0.008686  ...    10.0 -0.014052  0.003137
Sex           10.0  0.025973  0.017449  ...    10.0  0.017622  0.006852
Vineland_PCA  10.0 -0.002877  0.031596  ...    10.0  0.052315  0.013414
WISC_PCA      10.0 -0.027432  0.101222  ...    10.0  0.038064  0.019407

[12 rows x 9 columns]
Display
Display subject’s (dis)similarity matrices.
ncols = n_samples
nrows = len(data)
plt.figure(figsize=np.array((ncols, nrows)) * 4)
idx1 = 0
for name, sdata in data.items():
    _name = " ".join(name.split("_"))
    for idx2, smat in enumerate(sdata):
        ax = plt.subplot(nrows, ncols, idx1 + 1)
        plot_mat(f"{_name} ({idx2 + 1})", smat, ax=ax, figsize=None,
                 dpi=300, fontsize=9)
        idx1 += 1
plt.subplots_adjust(
    left=None, bottom=None, right=None, top=None, wspace=.5, hspace=.5)
plt.suptitle("SUBJECTS (S) MAT", fontsize=20, y=.95)
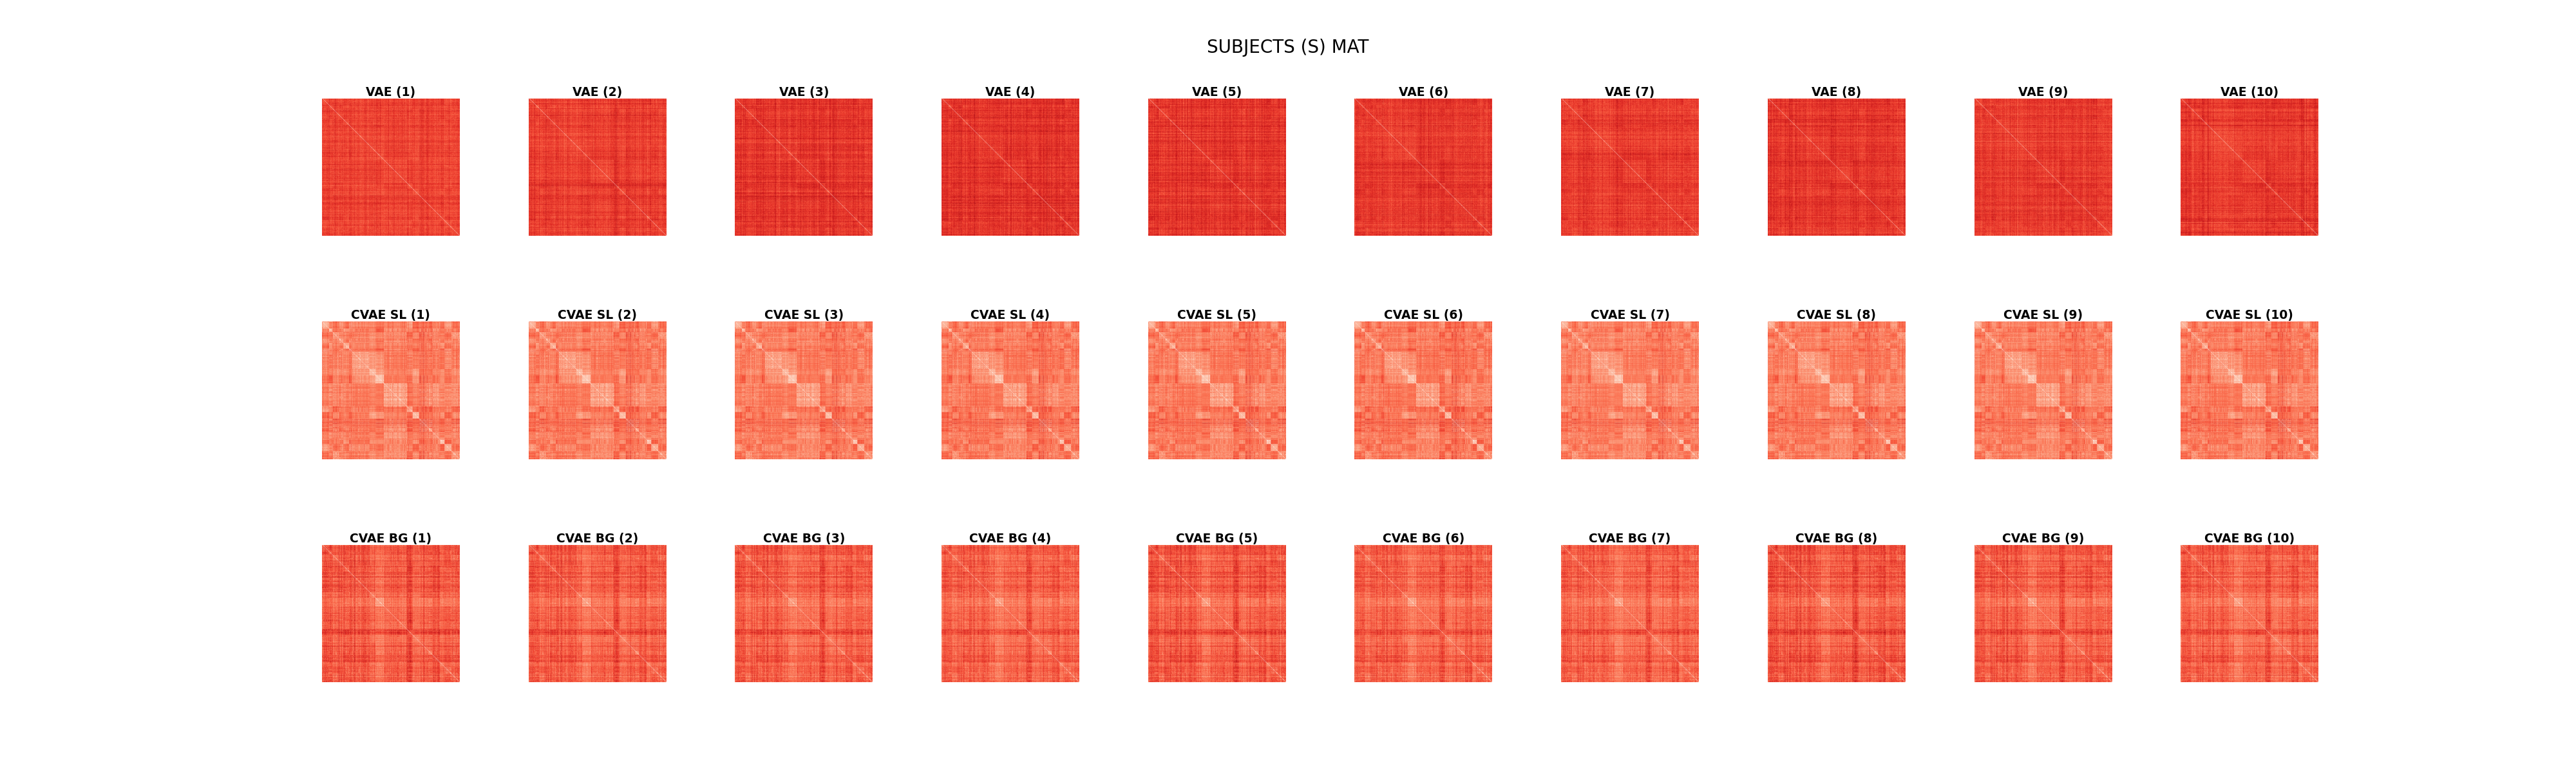
Text(0.5, 0.95, 'SUBJECTS (S) MAT')
Display score’s (dis)similarity matrices.
ncols = 4
nrows = int(np.ceil(len(model_cmats) / ncols))
plt.figure(figsize=np.array((ncols, nrows)) * 4)
for idx, (name, cmat) in enumerate(model_cmats.items()):
    _name = " ".join(name.split("_"))
    ax = plt.subplot(nrows, ncols, idx + 1)
    plot_mat(_name.upper(), cmat, ax=ax, figsize=None, dpi=300,
             fontsize=12)
plt.subplots_adjust(
    left=None, bottom=None, right=None, top=None, wspace=.5, hspace=.5)
plt.suptitle("CLINICAL (C) MAT", fontsize=20, y=.95)
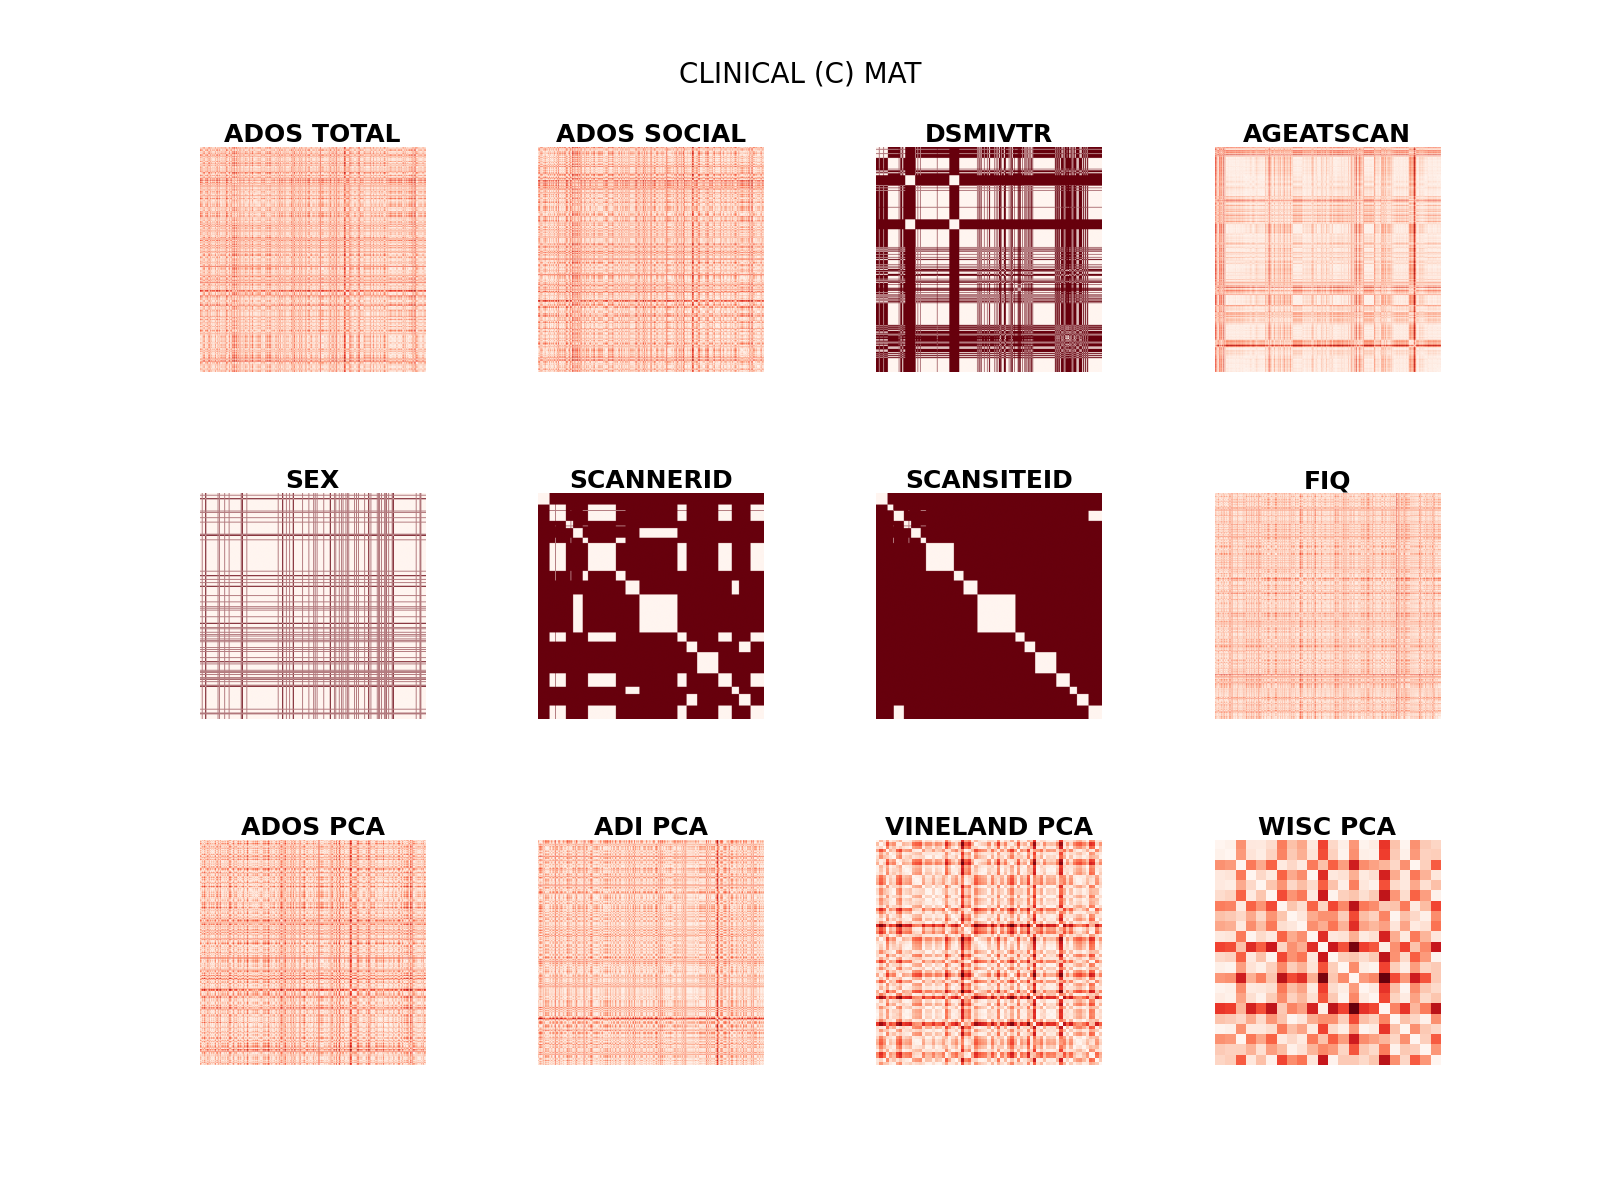
Text(0.5, 0.95, 'CLINICAL (C) MAT')
Display Kendall tau statistics.
ncols = 3
nrows = int(np.ceil(len(clinical_scores) / ncols))
plt.figure(figsize=np.array((ncols, nrows)) * 4)
pairwise_stats = []
for idx, qname in enumerate(clinical_scores):
    ax = plt.subplot(nrows, ncols, idx + 1)
    pairwise_stat_df = plot_bar(
        qname, rsa_results, ax=ax, figsize=None, dpi=300, fontsize=7,
        fontsize_star=12, fontweight="bold", line_width=2.5,
        marker_size=3, title=qname.upper(), report_t=True,
        do_one_sample_stars=True, do_pairwise_stars=True, palette="Set2",
        yname="correlation")
    if pairwise_stat_df is not None:
        pairwise_stats.append(pairwise_stat_df)
if len(pairwise_stats) > 0:
    pairwise_stat_df = pd.concat(pairwise_stats)
    print(pairwise_stat_df)
plt.subplots_adjust(
    left=None, bottom=None, right=None, top=None, wspace=.5, hspace=.5)
plt.suptitle("RSA RESULTS", fontsize=20, y=.95)

plt.show()
/home/runner/work/cookbook/cookbook/examples/latent/plot_rsa.py:190: FutureWarning:

Passing `palette` without assigning `hue` is deprecated and will be removed in v0.14.0. Assign the `x` variable to `hue` and set `legend=False` for the same effect.

  plot = sns.barplot(data=data_df,
ADOS_Total VAE >  VAE | t(9) = 0.00 p = 1.00
ADOS_Total VAE >  CVAE_SL | t(9) = -0.65 p = 0.52
ADOS_Total VAE >  CVAE_BG | t(9) = -4.23 p < .001
ADOS_Total CVAE_SL >  VAE | t(9) = 0.65 p = 0.52
ADOS_Total CVAE_SL >  CVAE_SL | t(9) = 0.00 p = 1.00
ADOS_Total CVAE_SL >  CVAE_BG | t(9) = -11.04 p < .001
ADOS_Total CVAE_BG >  VAE | t(9) = 4.23 p < .001
ADOS_Total CVAE_BG >  CVAE_SL | t(9) = 11.04 p < .001
ADOS_Total CVAE_BG >  CVAE_BG | t(9) = 0.00 p = 1.00
p-value annotation legend:
      ns: 5.00e-02 < p <= 1.00e+00
       *: 1.00e-02 < p <= 5.00e-02
      **: 1.00e-03 < p <= 1.00e-02
     ***: 1.00e-04 < p <= 1.00e-03
    ****: p <= 1.00e-04

CVAE_SL vs. CVAE_BG: ***
VAE vs. CVAE_BG: **
/home/runner/work/cookbook/cookbook/examples/latent/plot_rsa.py:190: FutureWarning:

Passing `palette` without assigning `hue` is deprecated and will be removed in v0.14.0. Assign the `x` variable to `hue` and set `legend=False` for the same effect.

  plot = sns.barplot(data=data_df,
ADOS_Social VAE >  VAE | t(9) = 0.00 p = 1.00
ADOS_Social VAE >  CVAE_SL | t(9) = 0.05 p = 0.96
ADOS_Social VAE >  CVAE_BG | t(9) = -1.68 p = 0.11
ADOS_Social CVAE_SL >  VAE | t(9) = -0.05 p = 0.96
ADOS_Social CVAE_SL >  CVAE_SL | t(9) = 0.00 p = 1.00
ADOS_Social CVAE_SL >  CVAE_BG | t(9) = -7.18 p < .001
ADOS_Social CVAE_BG >  VAE | t(9) = 1.68 p = 0.11
ADOS_Social CVAE_BG >  CVAE_SL | t(9) = 7.18 p < .001
ADOS_Social CVAE_BG >  CVAE_BG | t(9) = 0.00 p = 1.00
p-value annotation legend:
      ns: 5.00e-02 < p <= 1.00e+00
       *: 1.00e-02 < p <= 5.00e-02
      **: 1.00e-03 < p <= 1.00e-02
     ***: 1.00e-04 < p <= 1.00e-03
    ****: p <= 1.00e-04

CVAE_SL vs. CVAE_BG: ***
/home/runner/work/cookbook/cookbook/examples/latent/plot_rsa.py:190: FutureWarning:

Passing `palette` without assigning `hue` is deprecated and will be removed in v0.14.0. Assign the `x` variable to `hue` and set `legend=False` for the same effect.

  plot = sns.barplot(data=data_df,
DSMIVTR VAE >  VAE | t(9) = 0.00 p = 1.00
DSMIVTR VAE >  CVAE_SL | t(9) = 1.37 p = 0.19
DSMIVTR VAE >  CVAE_BG | t(9) = -5.51 p < .001
DSMIVTR CVAE_SL >  VAE | t(9) = -1.37 p = 0.19
DSMIVTR CVAE_SL >  CVAE_SL | t(9) = 0.00 p = 1.00
DSMIVTR CVAE_SL >  CVAE_BG | t(9) = -19.86 p < .001
DSMIVTR CVAE_BG >  VAE | t(9) = 5.51 p < .001
DSMIVTR CVAE_BG >  CVAE_SL | t(9) = 19.86 p < .001
DSMIVTR CVAE_BG >  CVAE_BG | t(9) = 0.00 p = 1.00
p-value annotation legend:
      ns: 5.00e-02 < p <= 1.00e+00
       *: 1.00e-02 < p <= 5.00e-02
      **: 1.00e-03 < p <= 1.00e-02
     ***: 1.00e-04 < p <= 1.00e-03
    ****: p <= 1.00e-04

CVAE_SL vs. CVAE_BG: ***
VAE vs. CVAE_BG: ***
/home/runner/work/cookbook/cookbook/examples/latent/plot_rsa.py:190: FutureWarning:

Passing `palette` without assigning `hue` is deprecated and will be removed in v0.14.0. Assign the `x` variable to `hue` and set `legend=False` for the same effect.

  plot = sns.barplot(data=data_df,
AgeAtScan VAE >  VAE | t(9) = 0.00 p = 1.00
AgeAtScan VAE >  CVAE_SL | t(9) = -15.72 p < .001
AgeAtScan VAE >  CVAE_BG | t(9) = -6.91 p < .001
AgeAtScan CVAE_SL >  VAE | t(9) = 15.72 p < .001
AgeAtScan CVAE_SL >  CVAE_SL | t(9) = 0.00 p = 1.00
AgeAtScan CVAE_SL >  CVAE_BG | t(9) = 21.46 p < .001
AgeAtScan CVAE_BG >  VAE | t(9) = 6.91 p < .001
AgeAtScan CVAE_BG >  CVAE_SL | t(9) = -21.46 p < .001
AgeAtScan CVAE_BG >  CVAE_BG | t(9) = 0.00 p = 1.00
p-value annotation legend:
      ns: 5.00e-02 < p <= 1.00e+00
       *: 1.00e-02 < p <= 5.00e-02
      **: 1.00e-03 < p <= 1.00e-02
     ***: 1.00e-04 < p <= 1.00e-03
    ****: p <= 1.00e-04

VAE vs. CVAE_SL: ***
CVAE_SL vs. CVAE_BG: ***
VAE vs. CVAE_BG: ***
/home/runner/work/cookbook/cookbook/examples/latent/plot_rsa.py:190: FutureWarning:

Passing `palette` without assigning `hue` is deprecated and will be removed in v0.14.0. Assign the `x` variable to `hue` and set `legend=False` for the same effect.

  plot = sns.barplot(data=data_df,
Sex VAE >  VAE | t(9) = 0.00 p = 1.00
Sex VAE >  CVAE_SL | t(9) = -3.61 p = 0.00
Sex VAE >  CVAE_BG | t(9) = 1.41 p = 0.18
Sex CVAE_SL >  VAE | t(9) = 3.61 p = 0.00
Sex CVAE_SL >  CVAE_SL | t(9) = 0.00 p = 1.00
Sex CVAE_SL >  CVAE_BG | t(9) = 11.37 p < .001
Sex CVAE_BG >  VAE | t(9) = -1.41 p = 0.18
Sex CVAE_BG >  CVAE_SL | t(9) = -11.37 p < .001
Sex CVAE_BG >  CVAE_BG | t(9) = 0.00 p = 1.00
p-value annotation legend:
      ns: 5.00e-02 < p <= 1.00e+00
       *: 1.00e-02 < p <= 5.00e-02
      **: 1.00e-03 < p <= 1.00e-02
     ***: 1.00e-04 < p <= 1.00e-03
    ****: p <= 1.00e-04

VAE vs. CVAE_SL: *
CVAE_SL vs. CVAE_BG: ***
/home/runner/work/cookbook/cookbook/examples/latent/plot_rsa.py:190: FutureWarning:

Passing `palette` without assigning `hue` is deprecated and will be removed in v0.14.0. Assign the `x` variable to `hue` and set `legend=False` for the same effect.

  plot = sns.barplot(data=data_df,
ScannerID VAE >  VAE | t(9) = 0.00 p = 1.00
ScannerID VAE >  CVAE_SL | t(9) = -23.33 p < .001
ScannerID VAE >  CVAE_BG | t(9) = 20.13 p < .001
ScannerID CVAE_SL >  VAE | t(9) = 23.33 p < .001
ScannerID CVAE_SL >  CVAE_SL | t(9) = 0.00 p = 1.00
ScannerID CVAE_SL >  CVAE_BG | t(9) = 114.23 p < .001
ScannerID CVAE_BG >  VAE | t(9) = -20.13 p < .001
ScannerID CVAE_BG >  CVAE_SL | t(9) = -114.23 p < .001
ScannerID CVAE_BG >  CVAE_BG | t(9) = 0.00 p = 1.00
p-value annotation legend:
      ns: 5.00e-02 < p <= 1.00e+00
       *: 1.00e-02 < p <= 5.00e-02
      **: 1.00e-03 < p <= 1.00e-02
     ***: 1.00e-04 < p <= 1.00e-03
    ****: p <= 1.00e-04

VAE vs. CVAE_SL: ***
CVAE_SL vs. CVAE_BG: ***
VAE vs. CVAE_BG: ***
/home/runner/work/cookbook/cookbook/examples/latent/plot_rsa.py:190: FutureWarning:

Passing `palette` without assigning `hue` is deprecated and will be removed in v0.14.0. Assign the `x` variable to `hue` and set `legend=False` for the same effect.

  plot = sns.barplot(data=data_df,
ScanSiteID VAE >  VAE | t(9) = 0.00 p = 1.00
ScanSiteID VAE >  CVAE_SL | t(9) = -63.88 p < .001
ScanSiteID VAE >  CVAE_BG | t(9) = -5.42 p < .001
ScanSiteID CVAE_SL >  VAE | t(9) = 63.88 p < .001
ScanSiteID CVAE_SL >  CVAE_SL | t(9) = 0.00 p = 1.00
ScanSiteID CVAE_SL >  CVAE_BG | t(9) = 185.14 p < .001
ScanSiteID CVAE_BG >  VAE | t(9) = 5.42 p < .001
ScanSiteID CVAE_BG >  CVAE_SL | t(9) = -185.14 p < .001
ScanSiteID CVAE_BG >  CVAE_BG | t(9) = 0.00 p = 1.00
p-value annotation legend:
      ns: 5.00e-02 < p <= 1.00e+00
       *: 1.00e-02 < p <= 5.00e-02
      **: 1.00e-03 < p <= 1.00e-02
     ***: 1.00e-04 < p <= 1.00e-03
    ****: p <= 1.00e-04

VAE vs. CVAE_SL: ***
CVAE_SL vs. CVAE_BG: ***
VAE vs. CVAE_BG: ***
/home/runner/work/cookbook/cookbook/examples/latent/plot_rsa.py:190: FutureWarning:

Passing `palette` without assigning `hue` is deprecated and will be removed in v0.14.0. Assign the `x` variable to `hue` and set `legend=False` for the same effect.

  plot = sns.barplot(data=data_df,
FIQ VAE >  VAE | t(9) = 0.00 p = 1.00
FIQ VAE >  CVAE_SL | t(9) = 0.59 p = 0.56
FIQ VAE >  CVAE_BG | t(9) = -1.81 p = 0.09
FIQ CVAE_SL >  VAE | t(9) = -0.59 p = 0.56
FIQ CVAE_SL >  CVAE_SL | t(9) = 0.00 p = 1.00
FIQ CVAE_SL >  CVAE_BG | t(9) = -12.72 p < .001
FIQ CVAE_BG >  VAE | t(9) = 1.81 p = 0.09
FIQ CVAE_BG >  CVAE_SL | t(9) = 12.72 p < .001
FIQ CVAE_BG >  CVAE_BG | t(9) = 0.00 p = 1.00
p-value annotation legend:
      ns: 5.00e-02 < p <= 1.00e+00
       *: 1.00e-02 < p <= 5.00e-02
      **: 1.00e-03 < p <= 1.00e-02
     ***: 1.00e-04 < p <= 1.00e-03
    ****: p <= 1.00e-04

CVAE_SL vs. CVAE_BG: ***
                                         pair       tval          pval
0           qname-ADOS_Total_src-VAE_dest-VAE   0.000000  1.000000e+00
1       qname-ADOS_Total_src-VAE_dest-CVAE-SL  -0.651633  5.228717e-01
2       qname-ADOS_Total_src-VAE_dest-CVAE-BG  -4.230940  5.024791e-04
3       qname-ADOS_Total_src-CVAE-SL_dest-VAE   0.651633  5.228717e-01
4   qname-ADOS_Total_src-CVAE-SL_dest-CVAE-SL   0.000000  1.000000e+00
..                                        ...        ...           ...
4          qname-FIQ_src-CVAE-SL_dest-CVAE-SL   0.000000  1.000000e+00
5          qname-FIQ_src-CVAE-SL_dest-CVAE-BG -12.716806  1.972201e-10
6              qname-FIQ_src-CVAE-BG_dest-VAE   1.808480  8.726890e-02
7          qname-FIQ_src-CVAE-BG_dest-CVAE-SL  12.716806  1.972201e-10
8          qname-FIQ_src-CVAE-BG_dest-CVAE-BG   0.000000  1.000000e+00

[72 rows x 3 columns]
Total running time of the script: (1 minutes 22.812 seconds)
Estimated memory usage: 5199 MB