Note
Go to the end to download the full example code.
Plotting data on cortical surface
Display a custom texture on the cortical surface.
import os
import string

import matplotlib.pyplot as plt
import nibabel
import numpy as np
import pandas as pd
from matplotlib.gridspec import GridSpec
from nilearn import plotting
from nilearn.datasets import fetch_atlas_surf_destrieux, fetch_surf_fsaverage
from nilearn.surface import load_surf_mesh
from tqdm import tqdm


def plot_surf(textures, titles, meshs, bg_maps, filename=None,
              config="fsaverage"):
    """ Display data (texture) on a brain mesh.

    Parameters
    ----------
    textures: list of tuple
        a list of textures to be displayed. Each item contains the left and
        right texture, respectively.
    titles: list
        the titles to be displayed.
    meshs: 2-uplet
        surface mesh geometry: a valid .gii file for the left and right
        hemispheres.
    bg_maps: 2-uplet
        background image to be plotted on the mesh underneath the texture in
        grayscale.
    filename: str, default None
        filename of the saved figure (with the extension).
    config: str, default 'fsaverage'
        the rendering options.

    Returns
    -------
    fig: pyplot.figure
        the generated figure.
    """
    # Parameters
    assert len(textures) == len(titles)

    # Surface mesh
    reference_surfs = {}
    for path, hemi in zip(meshs, ("left", "right"), strict=True):
        surface = nibabel.load(path)
        vertices, triangles = surface.agg_data()
        reference_surfs[hemi] = (vertices, triangles)

    # Generate views
    nmodels = len(titles)
    if config == "fsaverageflat":
        nview = 2
        hemis = [
            "right", "left"
        ]
        views = [
            "dorsal", "ventral"
        ]
        dtypes = [
            "single", "single"
        ]
        offsets = [
            (0, 0, 0), (0, 0, 0)
        ]
    elif config == "fsaverage":
        nview = 6
        hemis = [
            "right", "right", "left", "left",
            "right", "right", "left", "left",
        ]
        views = [
            "lateral", "dorsal", "dorsal", "lateral",
            "medial", "ventral", "ventral", "medial"
        ]
        dtypes = [
            "single", "combo-1", "combo-2", "single",
            "single", "combo-1", "combo-2", "single"
        ]
        offsets = [
            (0, 0, 0), (45, 0, 0), (-45, 0, 0), (0, 0, 0),
            (0, 0, 0), (45, 0, 0), (-45, 0, 0), (0, 0, 0)
        ]
    else:
        raise ValueError("Unknown config option!")
    fig = plt.figure(figsize=(15, 1 + 3 * nmodels))
    gs = GridSpec(nmodels, nview, figure=fig, width_ratios=[1] * nview,
                  wspace=0.0, hspace=0.3, top=0.85)
    for idx_i, name in enumerate(titles):
        data, data_bg = {}, {}
        for obj_, bg_, hemi in zip(
                textures[idx_i], bg_maps, ("left", "right"), strict=True):
            if not isinstance(obj_, np.ndarray):
                data[hemi] = nibabel.load(obj_).agg_data()
            else:
                data[hemi] = obj_
            data_bg[hemi] = bg_
        view_idx, ax = 0, None
        axs = []
        for idx_j in tqdm(range(len(views)), desc=name):
            if ax is None:
                ax = fig.add_subplot(gs[idx_i, view_idx], zorder=20,
                                     projection="3d")
                axs.append(ax)
                transform = None
            texture = data[hemis[idx_j]]
            vmin = min([0, min(texture)])
            vmax = max(texture)
            vertices, triangles = reference_surfs[hemis[idx_j]]
            plotting.plot_surf(
                (vertices + offsets[idx_j], triangles),
                surf_map=texture,
                hemi=hemis[idx_j], view=views[idx_j],
                cmap="gist_ncar", vmin=vmin, vmax=vmax, axes=ax,
                bg_map=data_bg[hemis[idx_j]], alpha=0.95,
                colorbar=False, threshold=0.001)
            if dtypes[idx_j] == "combo-2":
                for coll in ax.collections[-1:]:
                    coll._vec += np.array([[-45], [0], [0], [0]])
            elif dtypes[idx_j] == "combo-1":
                for coll in ax.collections[-1:]:
                    coll._vec += np.array([[45], [0], [0], [0]])
            for spine in ax.spines.values():
                spine.set_visible(False)
            if idx_j == 0:
                ax.text2D(-0.1, 1.1, f"{string.ascii_lowercase[idx_i]}|",
                          fontsize=20, weight="bold", transform=ax.transAxes)
                ax.text2D(0.2, 1.1, name, fontsize=16, weight="bold",
                          transform=ax.transAxes)
            if dtypes[idx_j] in ("single", "combo-2"):
                view_idx += 1
                ax = None
        if config != "fsaverageflat":
            axs[1].view_init(elev=90, azim=270)
            axs[4].view_init(elev=270, azim=90)

    # Save the figure in the desired format if enabled
    if filename is not None:
        fig.savefig(filename)

    return fig


def average(texture, labels):
    """ Average data (texture) on brain labels.

    Parameters
    ----------
    texture: array (N, )
        input texture to be average.
    labels: array (N, )
        input labels.

    Returns
    -------
    avg_texture: array (N, )
        the average input texture.
    """
    if not isinstance(texture, np.ndarray):
        texture = nibabel.load(texture).agg_data()
    assert texture.shape == labels.shape
    avg_texture = np.zeros(texture.shape, dtype=texture.dtype)
    for cnt, idx in enumerate(np.unique(labels)):
        if idx <= 0:
            continue
        indices = (labels == idx)
        avg_texture[indices] = np.mean(texture[indices])
        if cnt > 10:
            break
    return avg_texture
First start by loading the fsaverage cortical surface, curvature texture, and Destrieux labels:
[fetch_atlas_surf_destrieux] Added README.md to /tmp
[fetch_atlas_surf_destrieux] Dataset created in /tmp/destrieux_surface
[fetch_atlas_surf_destrieux] Downloading data from
https://www.nitrc.org/frs/download.php/9343/lh.aparc.a2009s.annot ...
[fetch_atlas_surf_destrieux]  ...done. (0 seconds, 0 min)

[fetch_atlas_surf_destrieux] Downloading data from
https://www.nitrc.org/frs/download.php/9342/rh.aparc.a2009s.annot ...
[fetch_atlas_surf_destrieux]  ...done. (0 seconds, 0 min)

/home/runner/work/cookbook/cookbook/examples/plotting/plot_surface.py:187: UserWarning:
The following regions are present in the atlas look-up table,
but missing from the atlas image:

 index    name
     0 Unknown

  atlas = fetch_atlas_surf_destrieux(data_dir="/tmp")
/home/runner/work/cookbook/cookbook/examples/plotting/plot_surface.py:187: UserWarning:
The following regions are present in the atlas look-up table,
but missing from the atlas image:

 index    name
     0 Unknown

  atlas = fetch_atlas_surf_destrieux(data_dir="/tmp")
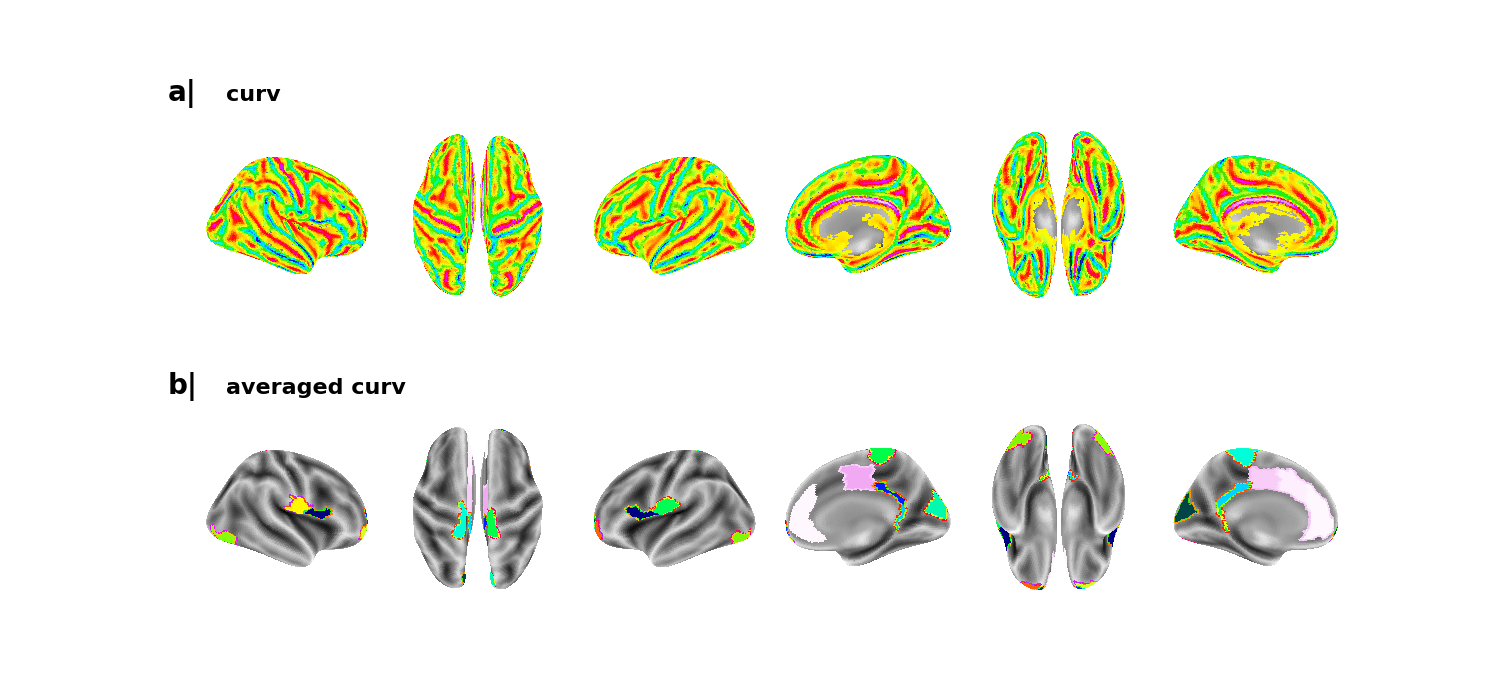
Now plot the curvature texture in a vertex-wise and ROI-wise fashions. Note that the average function selects the 10 first regions:
plot_surf(
    textures=[
        (data["curv_left"], data["curv_right"]),
        (average(data["curv_left"], atlas["map_left"]),
         average(data["curv_right"], atlas["map_right"]))
    ],
    titles=["curv", "averaged curv"],
    meshs=(data["infl_left"], data["infl_right"]),
    bg_maps=(data["sulc_left"], data["sulc_right"]),
    config="fsaverage"
)
curv:   0%|          | 0/8 [00:00<?, ?it/s]
curv:  25%|██▌       | 2/8 [00:00<00:00, 17.18it/s]
curv:  62%|██████▎   | 5/8 [00:00<00:00, 22.18it/s]
curv: 100%|██████████| 8/8 [00:00<00:00, 23.54it/s]
curv: 100%|██████████| 8/8 [00:00<00:00, 22.65it/s]

averaged curv:   0%|          | 0/8 [00:00<?, ?it/s]
averaged curv:  38%|███▊      | 3/8 [00:00<00:00, 24.47it/s]
averaged curv:  75%|███████▌  | 6/8 [00:00<00:00, 23.73it/s]
averaged curv: 100%|██████████| 8/8 [00:00<00:00, 24.56it/s]

<Figure size 1500x700 with 12 Axes>
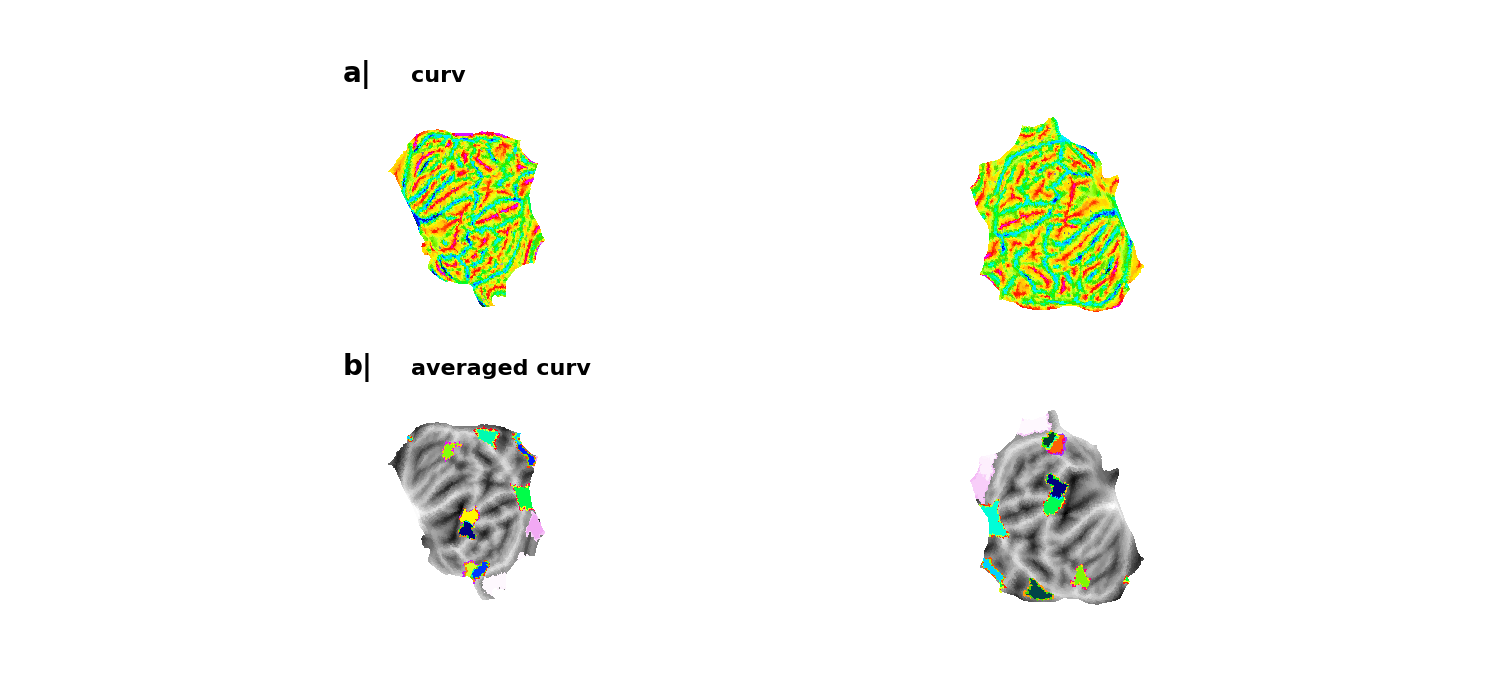
And also do the same plot on the flat mesh:
plot_surf(
    textures=[
        (data["curv_left"], data["curv_right"]),
        (average(data["curv_left"], atlas["map_left"]),
         average(data["curv_right"], atlas["map_right"]))
    ],
    titles=["curv", "averaged curv"],
    meshs=(data["flat_left"], data["flat_right"]),
    bg_maps=(data["sulc_left"], data["sulc_right"]),
    config="fsaverageflat"
)
# plotting.show()
curv:   0%|          | 0/2 [00:00<?, ?it/s]
curv:  50%|█████     | 1/2 [00:00<00:00,  8.99it/s]
curv: 100%|██████████| 2/2 [00:00<00:00, 12.17it/s]

averaged curv:   0%|          | 0/2 [00:00<?, ?it/s]
averaged curv: 100%|██████████| 2/2 [00:00<00:00, 18.41it/s]
averaged curv: 100%|██████████| 2/2 [00:00<00:00, 18.35it/s]

<Figure size 1500x700 with 4 Axes>
Total running time of the script: (0 minutes 30.133 seconds)
Estimated memory usage: 402 MB