9. fMRI Pre-Processing Workflow
9.1. Introduction
Preprocessing of functional MRI (fMRI) data is a crucial step in transforming raw scanner outputs into signals that can be meaningfully interpreted and compared across individuals. Raw fMRI volumes contain a variety of artifacts and sources of variability—such as head motion, scanner drift, geometric distortions, and physiological noise—that can obscure the underlying neural activity of interest. A standardized preprocessing workflow addresses these issues by aligning images across time and space, correcting for distortions, removing nuisance signals, and generating anatomically and functionally consistent representations of the data.
9.2. Requirements
CPU |
RAM |
|---|---|
1 |
10GB , 5 GB |
9.3. Description
Processing Steps
This analysis relies on fMRIPrep’s pipeline [1].
Anatomical Data Preprocessing The preprocessing relies on pre‑existing FreeSurfer reconstructions: fMRIPrep does not run or resume recon-all; instead, it uses the supplied surfaces and segmentations directly. The T1‑weighted image is processed through fMRIPrep’s standard anatomical workflow, including bias‑field correction, skull stripping, brain tissues segmentation and spatial normalization to the MNI152NLin2009cAsym template. No MSM surface alignment is performed. Outputs are generated in both native T1w space and the MNI152NLin2009cAsym template space (both native resolution and 2 mm).
Functional Data Preprocessing The preprocessing includes motion correction, susceptibility distortion correction using SyN (syn-sdc), and boundary‑based registration (bbr) to the anatomical image. Slice‑timing correction is explicitly disabled. Preprocessed BOLD data are resampled into the requested volumetric spaces: T1w space and the MNI152NLin2009cAsym template space (both native resolution and 2 mm).
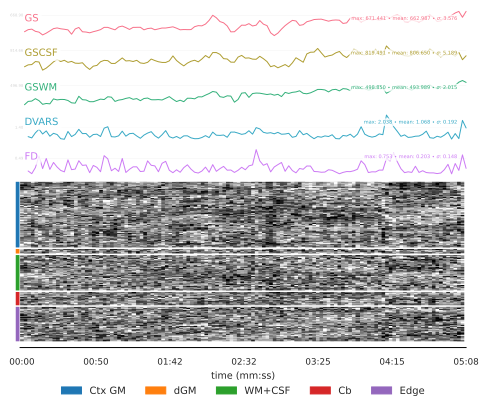
Confounding factors Several confounding time-series were calculated based on the preprocessed BOLD: framewise displacement (FD), DVARS and three region-wise global signals. FD was computed using two formulations(absolute sum of relative motions, relative root mean square displacement between affines). The three global signals are extracted within the CSF, the WM, and the whole-brain masks. Additionally, a set of physiological regressors were extracted to allow for component-based noise correction (CompCor). Principal components are estimated after high-pass filtering the preprocessed BOLD time-series (using a discrete cosine filter with 128s cut-off) for the two CompCor variants: temporal (tCompCor) and anatomical (aCompCor). tCompCor components are then calculated from the top 2% variable voxels within the brain mask. For aCompCor, three probabilistic masks (CSF, WM and combined CSF+WM) are generated in anatomical space. Finally, these masks are resampled into BOLD space. Components are also calculated separately within the WM and CSF masks. For each CompCor decomposition, the k components with the largest singular values are retained, such that the retained components’ time series are sufficient to explain 50 percent of variance across the nuisance mask (CSF, WM, combined, or temporal). The head-motion estimates calculated in the correction step were also placed within the corresponding confounds file. The confound time series derived from head motion estimates and global signals were expanded with the inclusion of temporal derivatives and quadratic terms for each. Additional nuisance timeseries are calculated by means of principal components analysis of the signal found within a thin band (crown) of voxels around the edge of the brain.
Surface Preprocessings Surface-based preprocessing is enabled through the combination of Functional data are projected onto the subject’s fsnative surfaces and then mapped to the fsLR surface space. CIFTI outputs at the 91k resolution are generating, producing dense time series suitable for surface-based analyses. Because MSM alignment is disabled, surface registration relies on the standard FreeSurfer‑to‑fsLR mapping.
Connectivity maps Nilearn is used to extract ROI time series and compute functional connectivity based on the Schaefer 200 ROI atlas. It applies the Yeo preprocessing pipeline, including detrending, filtering, confound regression, and standardization. Connectivity is computed using Pearson correlation.
Quality Control:
Confounding scores Images were classified as motion outliers when they exceeded established thresholds for head‑motion–related artifacts. Specifically, any volume with a mean framewise displacement greater than 0.2 mm, or with a mean standardized DVARS value exceeding 1.5, was flagged as low‑quality.
Manual inspection Subject‑level quality‑control HTML reports are reviewed manually to ensure that preprocessing outcomes are consistent across participants and that no systematic artifacts remain.
Entropy score The entropy score is thresholded at 12, such that images whose associated connectivity matrices do not exhibit meaningful structure are discarded. Accordingly, any image with an entropy greater than 12 is flagged as low-quality.
9.4. Outputs
The fmriprep directory contains subject-level results, logs, and
quality-control outputs.
The structure is organized following the brainprep ontology.
fmriprep/
├── dataset_description.json
├── figures
│   ├── histogram_dvars_std.png
│   └── histogram_fd_mean.png
├── log
│   └── report_<timestamp>.rst
├── quality_check
│   ├── motion_confounds.tsv
│   └── network_entropy.tsv
└── subjects
    ├── dataset_description.json
    ├── logs
    │   ├── CITATION.bib
    │   ├── CITATION.html
    │   ├── CITATION.md
    │   └── CITATION.tex
    ├── sub-01
    │   ├── figures
    │   └── ses-00
    │       ├── anat
    │       ├── figures
    │       │   ├── sub-01_ses-00_task-rest_run-01_space-MNI152NLin2009cAsym_atlas-schaefer200_desc-correlation_connectivity.png
    │       │   └── sub-01_ses-00_task-rest_run-01_space-MNI152NLin2009cAsym_atlas-schaefer200_desc-correlation_connectivity.tsv
    │       ├── func
    │       ├── log
    │       │   └── report_<timestamp>.rst
    │       └── workspace
    └── sub-01.html
Description of contents:
dataset_description.jsonMetadata describing the process, including versioning and processing information.figures/histogram_dvars_std.pngHistogram of mean standardized DVARS and applied threshold.figures/histogram_fd_mean.pngHistogram of mean FD and applied threshold.log/report_<timestamp>.rstContains group-level workflow steps and parameters.quality_check/motion_confounds.tsvTable containing the mean standardized DVARS and mean FD for each subject/session/run. The table includes a binaryqccolumn indicating the quality control result.quality_check/network_entropy.tsvTable containing the connectivity matrix entropy for each subject/session/run. The table includes a binaryqccolumn indicating the quality control result.subjects/dataset_description.jsonMetadata describing the process, including versioning and processing information.subjects/logsText description of the process.subjects/sub-<id>/figuresStandard fMRIPrep folder structure.subjects/sub-<id>/ses-<id>/anatStandard fMRIPrep folder structure.subjects/sub-<id>/ses-<id>/figures/*_space-MNI152NLin2009cAsym_atlas-schaefer200_desc-correlation_connectivity.pngDisplay of the estimated connectivity matrix.subjects/sub-<id>/ses-<id>/figures/*_space-MNI152NLin2009cAsym_atlas-schaefer200_desc-correlation_connectivity.pngTable containing the estimated connectivity matrixsubjects/sub-<id>/ses-<id>/funcStandard fMRIPrep folder structure.subjects/sub-<id>.htmlStandard fMRIPrep subject-level report.
9.5. Featured examples

fMRI Pre-Processing
Explore how to perform this analysis.