8. Surface-Based Morphometry Workflow
8.1. Introduction
Surface-based morphometry (SBM) is a structural MRI analysis framework that focuses on the geometry of the cerebral cortex rather than on voxelwise tissue properties. Using T1w images, SBM reconstructs the white matter and pial surfaces, enabling precise measurement of cortical features such as thickness, surface area, curvature, and folding patterns. SBM provides offers improved sensitivity to subtle cortical differences relative to traditional voxel-based approaches. This makes SBM a widely used tool for studying neurodevelopment, aging, and disease‑related cortical alterations.
8.2. Requirements
CPU |
RAM |
|---|---|
1 |
16 GB |
Using Nextflow requires 64 GB of memory and is therefore packaged separately within the subject‑level workflow.
Running the workflow requires a CPU with AVX or AVX2 support You can check this with:
lscpu | grep -i avx
8.3. Description
Processing Steps
Cortical analysis Cortical analysis relies on FreeSurfer’s recon‑all pipeline [1]. The analysis stream includes intensity normalization, skull stripping, segmentation of GM (pial) and WM, hemispheric-based tessellations, topology corrections and inflation, and registration to the
fsaveragetemplate.ROI-based morphological measures ROI-based morphological measures are extracted on both the Desikan [2] and Destrieux [3] parcellations, including seven ROI-based features: mean and standard deviation of cortical thickness, gray‑matter volume, surface area, integrated mean and Gaussian curvatures, and the intrinsic curvature index. Volumetric subcortical brain structure features are also extracted.
Vertex-wise morphological measures Vertex‑wise features (cortical thickness, curvature, and average convexity) are computed on the high‑resolution seventh-order icosahedral mesh, providing fine‑grained surface information [4]. To support inter‑hemispheric surface-based analyses, right-hemisphere features are mapped onto the left hemisphere using the symmetric
fsaverage_symtemplate and thexhemiroutines [5].
Quality Control
Euler score We use the Euler number as an image-quality metric and retain only those with values greater than −217, following the recommendation of :footcite:p:rosen2018. This filtering step ensures that images with insufficient topological stability or degradation are flagged as low‑quality.
8.4. Outputs
The sbm directory contains subject-level results, longitudinal results,
group-level results, logs, and quality-control outputs.
The structure is organized following the brainprep ontology.
sbm/
├── dataset_description.json
├── figures
│   └── histogram_euler_number.png
├── log
│   └── report_<timestamp>.rst
├── longitudinal
│   ├── figure
│   │   └── histogram_euler_number.png
│   ├── morphometry
│   │   ├── aparc2009s_ses-<study1|study2>_hemi-<lh|rh>_meas-area_stats.csv
│   │   ├── aparc2009s_ses-<study1|study2>_hemi-<lh|rh>_meas-curvind_stats.csv
│   │   ├── aparc2009s_ses-<study1|study2>_hemi-<lh|rh>_meas-foldind_stats.csv
│   │   ├── aparc2009s_ses-<study1|study2>_hemi-<lh|rh>_meas-gauscurv_stats.csv
│   │   ├── aparc2009s_ses-<study1|study2>_hemi-<lh|rh>_meas-meancurv_stats.csv
│   │   ├── aparc2009s_ses-<study1|study2>_hemi-<lh|rh>_meas-thickness_stats.csv
│   │   ├── aparc2009s_ses-<study1|study2>_hemi-<lh|rh>_hemi-lh_meas-thicknessstd_stats.csv
│   │   ├── aparc2009s_ses-<study1|study2>_hemi-<lh|rh>_meas-volume_stats.csv
│   │   ├── aparc_ses-<study1|study2>_hemi-<lh|rh>_meas-area_stats.csv
│   │   ├── aparc_ses-<study1|study2>_hemi-<lh|rh>_meas-curvind_stats.csv
│   │   ├── aparc_ses-<study1|study2>_hemi-<lh|rh>_meas-foldind_stats.csv
│   │   ├── aparc_ses-<study1|study2>_hemi-<lh|rh>_meas-gauscurv_stats.csv
│   │   ├── aparc_ses-<study1|study2>_hemi-<lh|rh>_meas-meancurv_stats.csv
│   │   ├── aparc_ses-<study1|study2>_hemi-<lh|rh>_meas-thickness_stats.csv
│   │   ├── aparc_ses-<study1|study2>_hemi-<lh|rh>_meas-thicknessstd_stats.csv
│   │   ├── aparc_ses-<study1|study2>_hemi-<lh|rh>_meas-volume_stats.csv
│   │   └── aseg_ses-<study1|study2>_stats.csv
│   ├── quality_check
│   │   └── euler_numbers.tsv
│   └── subjects
│       └── sub-02
│           ├── log
│           │   └── report_<timestamp>.rst
│           ├── ses-study1
│           │   └── run-01
│           │       ├── label
│           │       ├── mri
│           │       ├── scripts
│           │       ├── stats
│           │       ├── surf
│           │       ├── tmp
│           │       ├── touch
│           │       └── trash
│           ├── ses-study2
│           │   └── run-01
│           │       ├── label
│           │       ├── mri
│           │       ├── scripts
│           │       ├── stats
│           │       ├── surf
│           │       ├── tmp
│           │       ├── touch
│           │       └── trash
│           └── template
│               ├── base-tps
│               ├── label
│               ├── mri
│               ├── scripts
│               ├── stats
│               ├── surf
│               ├── tmp
│               ├── touch
│               └── trash
├── morphometry
│   ├── aparc2009s_ses-<study1|study2>_hemi-<lh|rh>_meas-area_stats.csv
│   ├── aparc2009s_ses-<study1|study2>_hemi-<lh|rh>_meas-curvind_stats.csv
│   ├── aparc2009s_ses-<study1|study2>_hemi-<lh|rh>_meas-foldind_stats.csv
│   ├── aparc2009s_ses-<study1|study2>_hemi-<lh|rh>_meas-gauscurv_stats.csv
│   ├── aparc2009s_ses-<study1|study2>_hemi-<lh|rh>_meas-meancurv_stats.csv
│   ├── aparc2009s_ses-<study1|study2>_hemi-<lh|rh>_meas-thickness_stats.csv
│   ├── aparc2009s_ses-<study1|study2>_hemi-<lh|rh>_hemi-lh_meas-thicknessstd_stats.csv
│   ├── aparc2009s_ses-<study1|study2>_hemi-<lh|rh>_meas-volume_stats.csv
│   ├── aparc_ses-<study1|study2>_hemi-<lh|rh>_meas-area_stats.csv
│   ├── aparc_ses-<study1|study2>_hemi-<lh|rh>_meas-curvind_stats.csv
│   ├── aparc_ses-<study1|study2>_hemi-<lh|rh>_meas-foldind_stats.csv
│   ├── aparc_ses-<study1|study2>_hemi-<lh|rh>_meas-gauscurv_stats.csv
│   ├── aparc_ses-<study1|study2>_hemi-<lh|rh>_meas-meancurv_stats.csv
│   ├── aparc_ses-<study1|study2>_hemi-<lh|rh>_meas-thickness_stats.csv
│   ├── aparc_ses-<study1|study2>_hemi-<lh|rh>_meas-thicknessstd_stats.csv
│   ├── aparc_ses-<study1|study2>_hemi-<lh|rh>_meas-volume_stats.csv
│   └── aseg_ses-<study1|study2>_stats.csv
├── quality_check
│   └── euler_numbers.tsv
└── subjects
    └── sub-01
        ├── ses-study1
        │   ├── figures
        │   │   └── sub-01_ses-study1_run-01_brainparc.png
        │   ├── log
        │   │   ├── report_<timestamp>.rst
        │   ├── run-01
        │   │   ├── label
        │   │   ├── mri
        │   │   ├── nextbrain
        │   │   ├── scripts
        │   │   ├── stats
        │   │   ├── surf
        │   │   ├── tmp
        │   │   ├── touch
        │   │   ├── trash
        │   │   └── xhemi
        └── ses-study2
            ├── figures
            │   └── sub-01_ses-study2_run-01_brainparc.png
            ├── log
            │   └── report_<timestamp>.rst
            └── run-01
                ├── label
                ├── mri
                ├── nextbrain
                ├── scripts
                ├── stats
                ├── surf
                ├── tmp
                ├── touch
                ├── trash
                └── xhemi
Description of contents:
dataset_description.jsonMetadata describing the process, including versioning and processing information.figures/histogram_euler_number.pngHistogram of Euler numbers across subjects and applied threshold, used to detect surface reconstruction failures or topological defects.log/report_<timestamp>.rstContains group-level workflow steps and parameters.longitudinal/figures/histogram_euler_number.pngHistogram of Euler numbers across subjects and applied threshold, used to detect surface reconstruction failures or topological defects.longitudinal/morphometryContains regional morphometric statistics derived from FreeSurfer parcellations. Each CSV file corresponds to a specific parcellation scheme (e.g.,aparc,aparc2009s), hemisphere (lhorrh), session (study1,study2), and measurement type (cortical area, curvature indices, cortical thickness, cortical volume). Additionally, contains volumetric segmentation statistics for subcortical structures (aseg_ses-study1_stats.csv,aseg_ses-study2_stats.csv).longitudinal/quality_check/euler_numbers.tsvTabulated Euler numbers for each subject and session, used to identify surface reconstruction issues. The table includes a binaryqccolumn indicating the quality control result.longitudinal/subjects/sub-<id>/log/report_<timestamp>.rstContains longitudinal workflow steps and parameters.longitudinal/subjects/sub-<id>/ses-<id>/run-<id>Standard FreeSurfer folder structure. An additionalrun-<id>hierarchy level is introduced to prevent filename collisions in datasets containing multiple T1w images, as FreeSurfer’s internal directory structure does not support this scenario by default.longitudinal/subjects/sub-<id>/templateThetemplatedirectory contains the longitudinal FreeSurfer template built across sessions.quality_check/euler_numbers.tsvTabulated Euler numbers for each subject and session and applied threshold, used to identify surface reconstruction issues.subjects/sub-<id>/ses-<id>/run-<id>Standard FreeSurfer folder structure. An additionalrun-<id>hierarchy level is introduced to prevent filename collisions in datasets containing multiple T1w images, as FreeSurfer’s internal directory structure does not support this scenario by default.
8.5. Featured examples

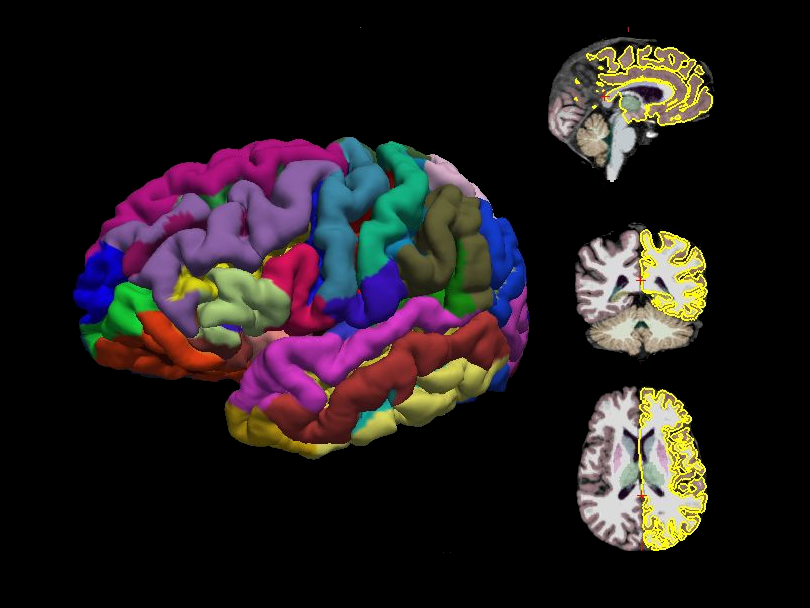
Brain Parcellation
Explore how to perform this analysis.